Lightning And Thunder
The Main Idea
I love thunderstorms. That crisp scent in the air, the sound of rain on the roof, and the feeling of fresh beginnings everywhere when the storm has passed. I also love the lightning and thunder that make up the heart of these storms. They never fail to move me. I’m not alone: in the ancient mysteries a device called a ceraunoscope was used to simulate lighting and thunder in religious ceremonies.
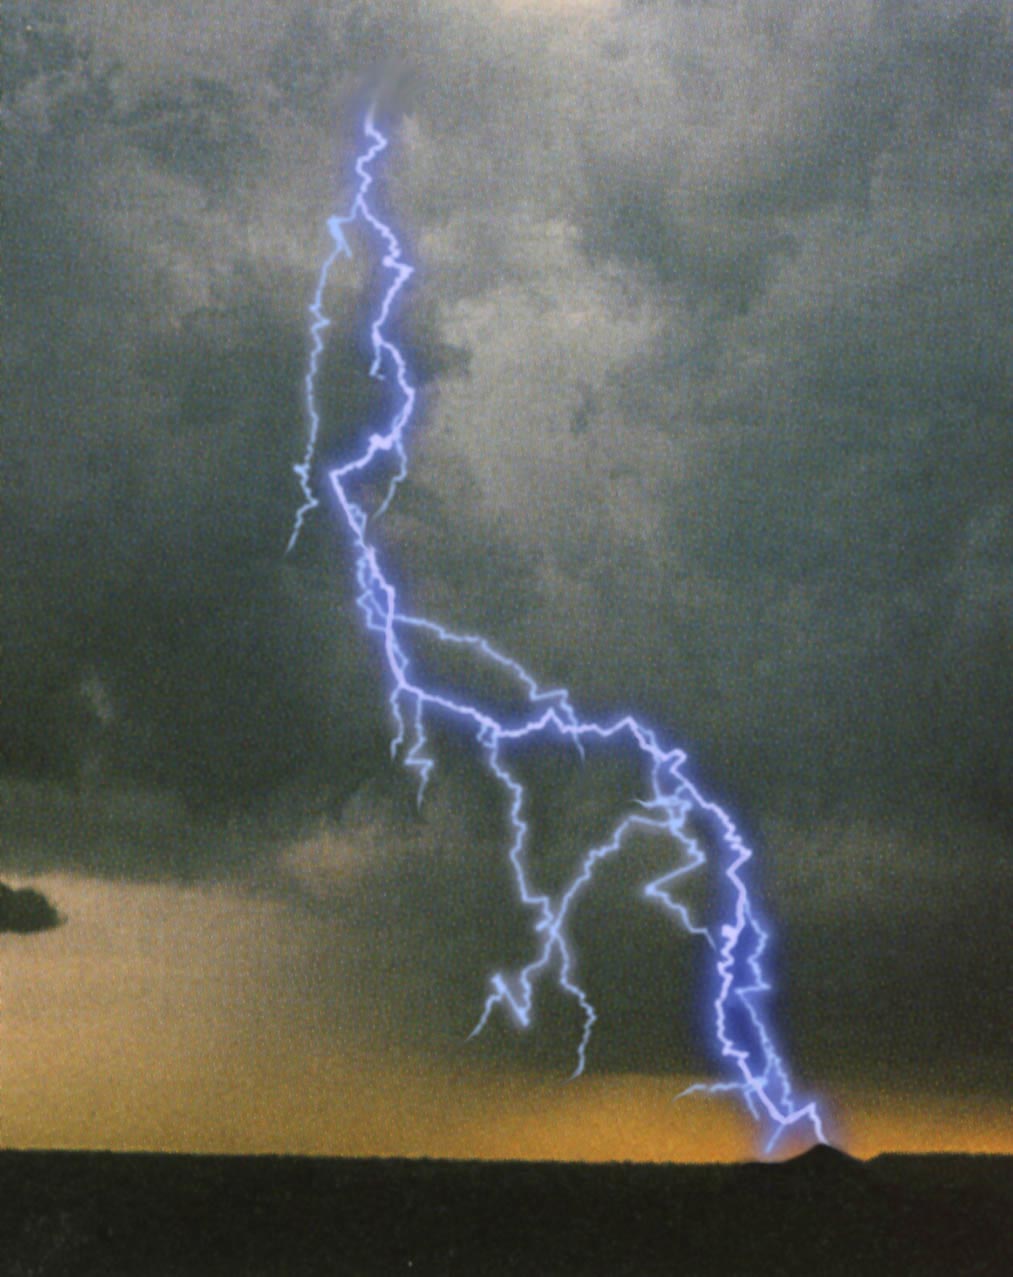 I decided to try to simulate both of these phenomena on the computer. Drawing something that looks like lightning is pretty easy, and making something that sounds like thunder isn’t much harder. But I wanted to do it right, and make physically accurate models. I wanted to draw lighting that could actually be real lightning. And more exciting, I wanted to create the actual thunder you would hear as a result of that specific lightning stroke. This meant learning about the structure of lightning and how it produces thunder, which are both fascinating physical processes every bit as beautiful as those that produce a rainbow or the aurora.
I contacted some atmospheric scientists and was surprised and delighted by their interest in this project and how helpful they were. Dr. Philip Krider of the University of Arizona sent me a huge box of tapes of digitized lightning strokes from the Apollo space program. In the 1960’s, NASA wanted to make sure that their launch structures would survive lightning strikes, so they took a large number of beautiful photos of lightning in their area. Once the photos were developed, one of Dr. Krider’s students spent long nights digitizing these photos in the old-fashioned way. The really old-fashioned way.
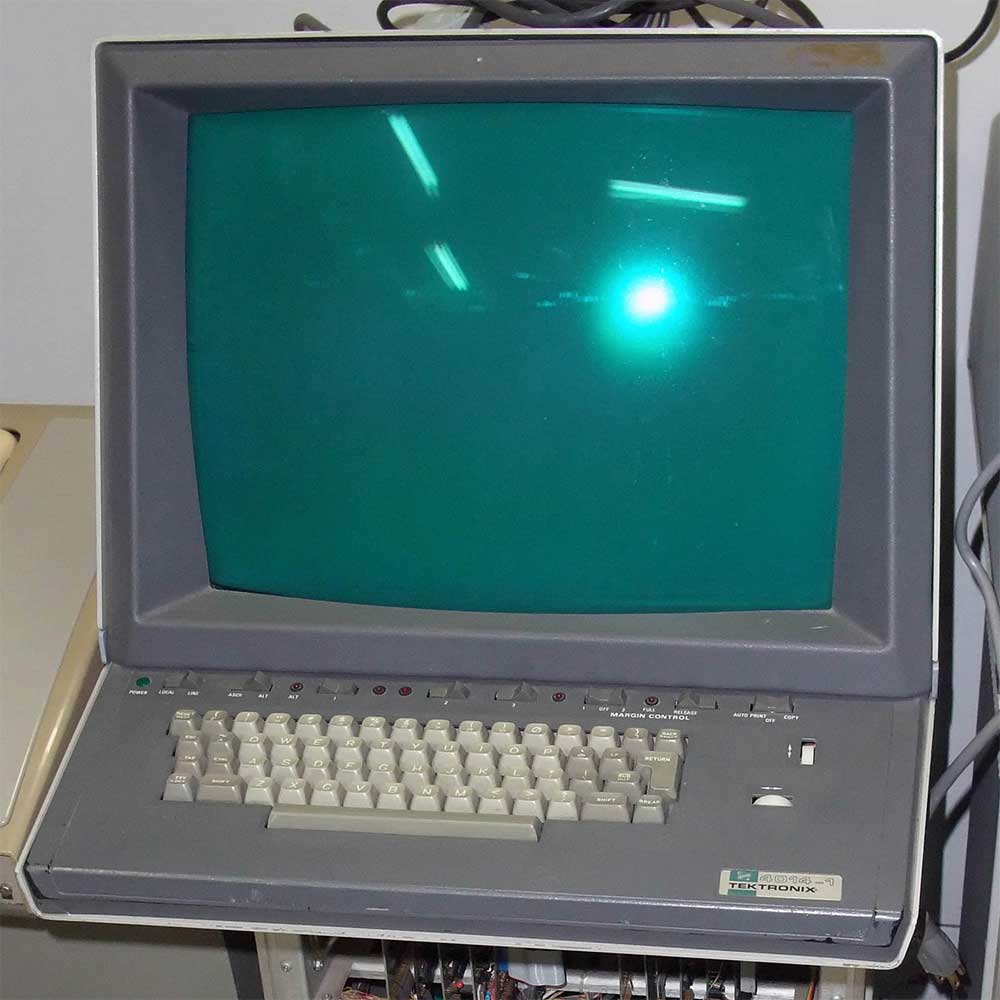 He printed them on transparent paper and taped them to the front of a Tektronix storage-tube monitor with a built-in tape drive. It probably looked like this photo of a Tektronix 4014, though this model is missing the slot for the tape. The student would pop a new tape cassette in the slot, and then using the two little white thumbwheels that controlled the on-screen crosshair, he laboriously positioned the crosshair under a point of the stroke, pressed a key on the keyboard, moved to the next point, pressed a key, and repeated the process over and over, all night long, night after night. The result was a series of enormous files, each containing thousands and thousands of (X,Y) pairs. The data was of course lacking the third dimension, but even so, it was the most complete set of lightning-geometry data ever assembled up to then.
Unfortunately, the project ran out of funding partway through. The tapes with the data were boxed up and set aside. By the time I came calling, the Tektronix monitor they’d used at the time was long gone and the tapes were unreadable. I called Tektronix, but that machine was already long out of production. They didn’t know where any working units were located, and they themselves had no idea how to read the tapes. I asked around to see if anyone had one of these antiques anywhere, and Dr. David Rogers had one in the basement of his building! He graciously spent a few lunch hours popping in tapes and dumping them into text files, which he sent me. Of course, I sent these files (and the original tapes) back to Dr. Krider, and now we held the world’s best lightning geometry data!
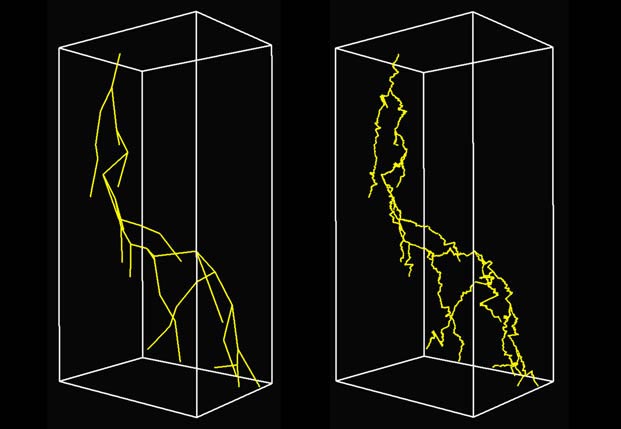 I started out by analyzing this data. I collected statistics on the average length of each straight section, the angle at which it turned, and how often a section branched. These parameters all vary with height (because of changes in the composition of the atmosphere). I fit polynomial surfaces to the data and got a very close match. Now I could use those equations to drive my simulation. I start by letting you, the designer, indicate the starting and ending points of a lightning stroke. From that, I use my data to develop the skeleton, shown here on the left. This is the essential backbone of the lightning, and its structure is what makes the results physically plausible. Although my data came from 2D photographs, I assumed that it was locally isotropic in order to create the 3D model. To this skeleton I add what lightning researchers describe as tortuosity, or the small variations along each piece that accounts for how the lightning actually propagates through the air.
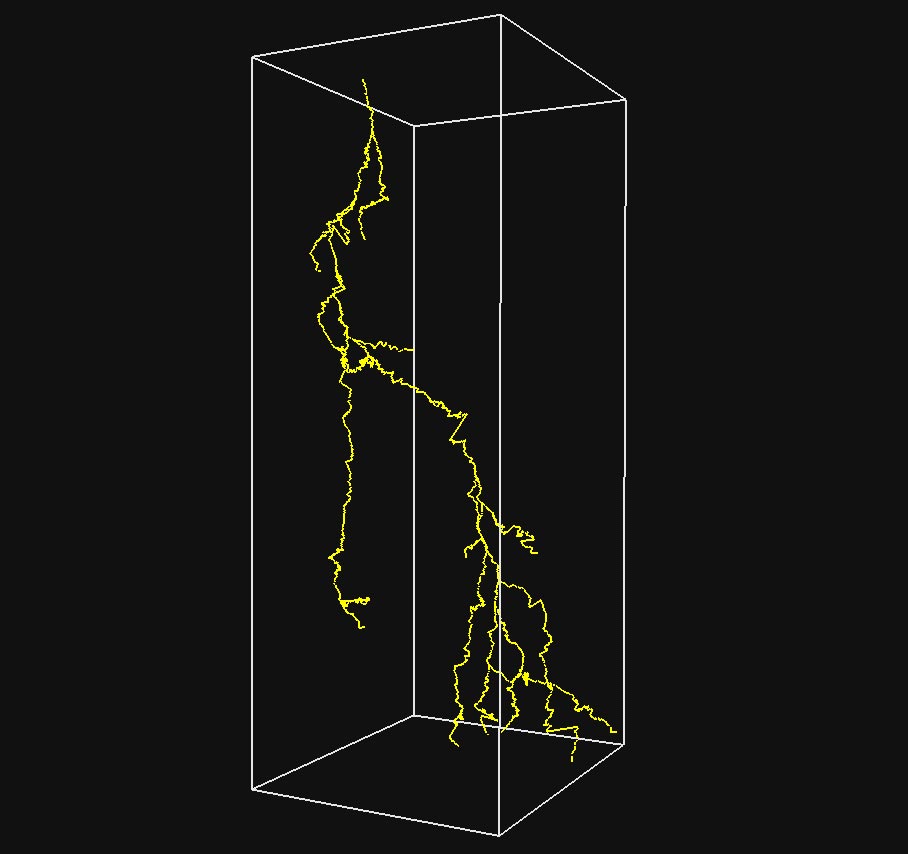 Here is a final 3D stroke. I don’t need to model the process by which the stroke is created, because that’s consistent in almost all cloud-to-ground lightning strokes. In brief, the lightning starts with an invisible small zone of electrical charge at the cloud that moves down to the ground. This generally moves in short, straight lines until it hits a pocket of the same charge in the air. Then the downward-moving stroke either changes direction to avoid the pocket, or it forks to get around it. When the charge finally reaches the ground, an enormous surge of electricity flows from the ground back up to the cloud. It’s this upward-flowing surge that creates the light we see (and the thunder we hear). Refuting popular myth, lightning usually strikes in the same place many times as additional bursts of electricity flow up from the ground. These repeated bursts cause the flickering we sometimes see when watching a lightning strike.
Now that we have 3D lightning, how do we make the thunder? Again, we turn to the atmospheric scientists who discovered that when the electricity flows up from the ground through the ionized channel cut by the lightning strike, it superheats the air and creates a short, intense shock wave. But interestingly, most of the shock waves along any straight section of lightning cancel each other out, leaving only the waves at the “corners” where the lightning changes direction or forks. Just a few meters from the lightning channel the shock waves settle down into a normal pressure waves which have a very specific shape. So knowing where an observer is located, I merely need to find the time of flight from each “corner” of the lightning channel to the observer, and sum up the pressure wave from each such corner (it’s important to handle refraction in the atmosphere, accounting for the varying density with height – in other words, the sounds don’t travel along straight lines). That’s the essence of the recipe for creating the actual thunder you would hear at that position from that lightning stroke.
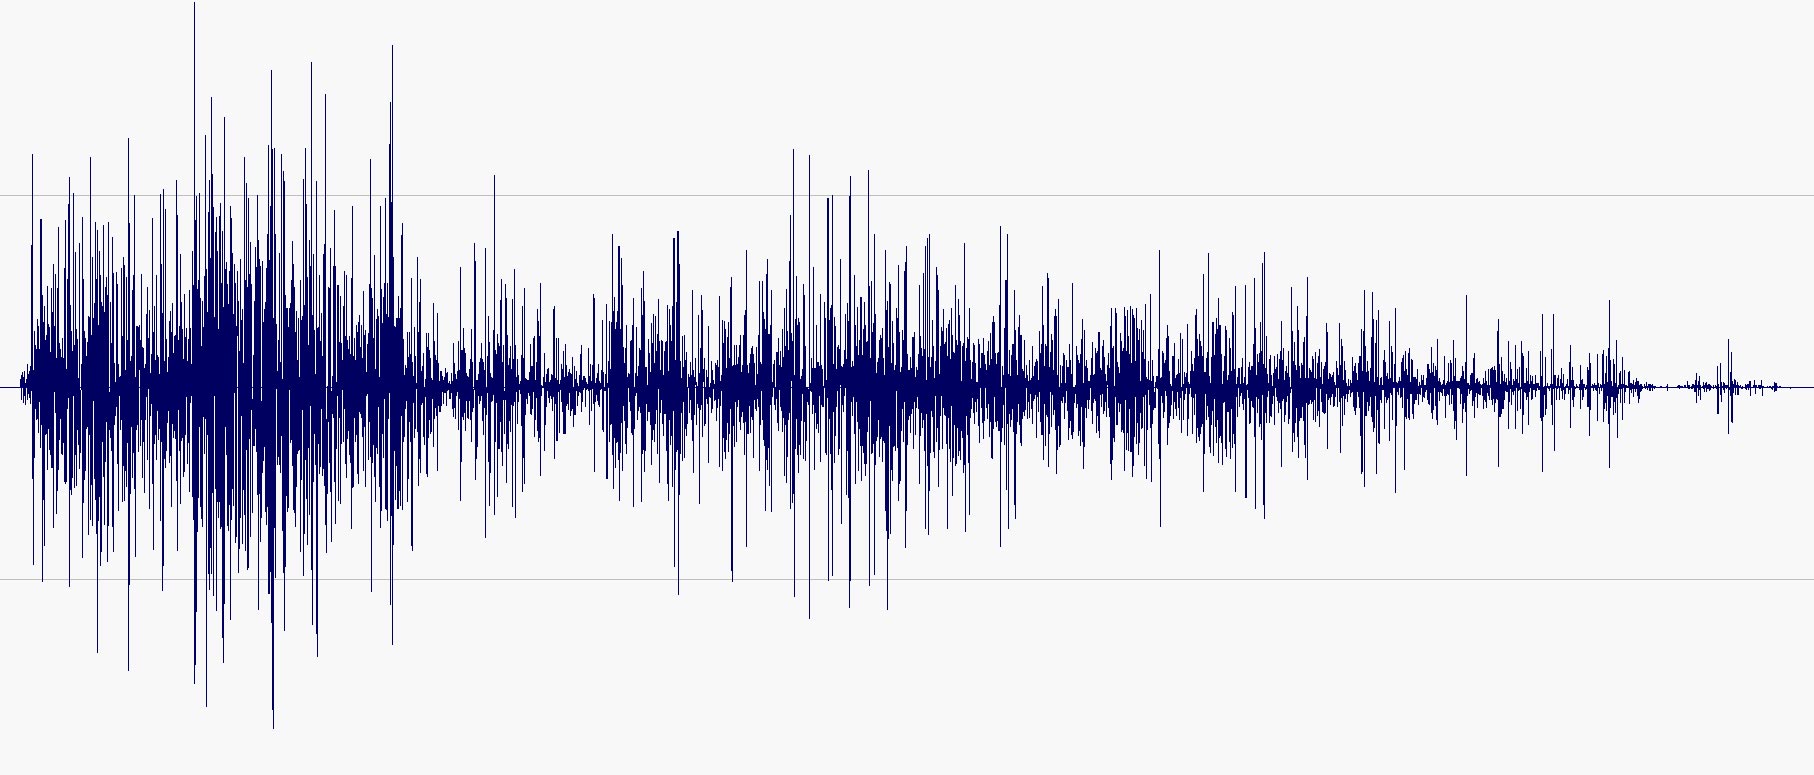 Here’s the waveform of a thunderclap. It starts out very loud and then diminishes. People have developed an impressive vocabulary for describing the different aspects of a thunderclap. There’s the clap, rumble, and roar, for instance, each with its own distinctive sound. When I was doing this research I sometimes played my synthesized thunder files loudly in my office, because I wanted to compare it to the sound of real, nearby thunder. Not only did it rattle my bookshelves, but it rattled some of the other people in offices along my corridor, who thought a storm was coming!
This project allowed me to create synthetic, controllable lightning that is statistically indistinguishable from real, physical lightning. And I can make the thunder from that specific lightning bolt. Because these phenomena exist in 3D in the computer, and can be synthesized on demand, they can be controlled and placed by a designer or filmmaker. In a sense, these lightning bolts are actors or props just like any other controllable part of a scene.
The image at the top of this page is one of my synthetic lightning bolts, correctly colored for the atmosphere for a desert afternoon sunstorm, and composited over a real photograph of a dark, pre-storm afternoon.
References
This work originally appeared in a technical report while I was working at Microsoft Research. I later expanded it a bit for a two-part column in IEEE Computer Graphics & Applications. Here are the complete citations:
Glassner, Andrew S., “The Digital Ceraunoscope: Synthetic Thunder and Lightning”, Microsoft Research Technical Report MSR-TR-99-17, April, 1999.
Glassner, Andrew S., “The Digital Ceraunoscope: Synthetic Lightning and Thunder, Part 1”, IEEE Computer Graphics & Applications, Volume 20, Number 2, March 2000
Glassner, Andrew S., “The Digital Ceraunoscope: Synthetic Lightning and Thunder, Part 2”, IEEE Computer Graphics & Applications, Volume 20, Number 3, May 2000
Leave a Reply
You must be logged in to post a comment.

Leave a Reply
You must be logged in to post a comment.